Measuring the Average Correlation of
Stocks in a Universe
[this page | pdf | references | back links]
1. The problem
Investors are interested in the average correlation between
stocks because it:
(a) has a potential
impact on their ability to add alpha; and
(b) affects the level of
portfolio risk they might be running.
How might we best estimate and measure ‘cross-stock’
correlation? By ‘best’ we mean a suitable combination involving both (i) ease
of computation and (ii) relevance to portfolio construction/risk analysis.
2. The problem
Tierens and
Anadu (2004) propose three alternative methods for estimating average stock
correlations:
(a) Calculate a full correlation matrix, weighting its
elements in line with the weight of the corresponding stocks in the
portfolio/index, and excluding correlations between the stock and itself (i.e.
the diagonal elements of the correlation matrix)
This involves the following formula, where  is the full
correlation matrix, weighting in line with product of the weights in the
portfolio of the stocks to which the relevant correlation coefficient relates,
but excluding diagonal elements, i.e.:
is the full
correlation matrix, weighting in line with product of the weights in the
portfolio of the stocks to which the relevant correlation coefficient relates,
but excluding diagonal elements, i.e.:
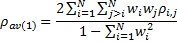
Tierens and Anadu argue that this approach yields the most
accurate measure of cross-stock correlation, because it uses all the different
pair-wise correlations. However, it comes at the expense of computational
complexity, as we require  correlation
coefficients as well as
correlation
coefficients as well as  portfolio
weights, i.e. a total of
portfolio
weights, i.e. a total of  inputs. Also,
Tierens and Anadu argued that it would in practice be impossible to apply this
methodology to compute average market-implied correlations.
inputs. Also,
Tierens and Anadu argued that it would in practice be impossible to apply this
methodology to compute average market-implied correlations.
(b) Proxy average correlation using only individual
stock volatilities and that of the portfolio/index as a whole
We start from the definition of (variance-related) portfolio
risk as:
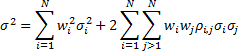
where  is the
volatility of the total return of stock
is the
volatility of the total return of stock  and
and  is
the volatility of the total return of the portfolio.
is
the volatility of the total return of the portfolio.
If we replace by an average
we can back out an implicit calculation for the average cross-sectional
correlation as follows:
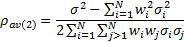
This avoids calculating inputs that require pair-wise
comparisons; the only inputs we need are single stock volatilities, single
stock weights and the volatility of the overall portfolio. The total number of
inputs therefore drops to  . Moreover, it
is more practical to apply this methodology to infer the level of average
market-implied correlation in the options market, by replacing realised stock
and portfolio volatilities by implied stock and portfolio (index) volatilities.
. Moreover, it
is more practical to apply this methodology to infer the level of average
market-implied correlation in the options market, by replacing realised stock
and portfolio volatilities by implied stock and portfolio (index) volatilities.
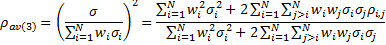
(c) Refine (b) by reference to the ratio of index to
average stock volatility
The third method follows the spirit of method (b) and
captures the intuition that the volatility of a portfolio is typically lower
than the weighted average volatility of the underlying constituents because
stocks are less than perfectly correlated. We might therefore, as a rule of
thumb, define:
3. Comments
3.1 Tierens and
Anadu (2004) compared method (b) and method (c) showed that method (b)
removes stock variance (as opposed to covariance) whilst method (c) doesn’t but
is otherwise similar to (b). A corollary is that as  (and
each
(and
each  ) these two
proxy methods will converge.
) these two
proxy methods will converge.
3.2 If we have stocks with identical volatilities
then methods (a) and (b) produce the same answer, but method (c) produces a
higher answer. However, for stocks with non-identical volatilities then there
may be a bias in method (b) too; each pair-wise correlation is weighted by how
the product of the volatilities for each of the two stocks in the pair compares
to the sum of the volatility products across all pairs of stocks. However, Tierens and
Anadu (2004) argue that biases introduced by the simpler methods (b) and
(c) appear to be modest in practice for well diversified portfolios/indices.
3.3 This discussion is potentially relevant to the
topic of calibrating assumed multivariate normal prior distributions to market
implied data, both for instrument pricing of more complicated derivatives and
for market implied risk management purposes, see Calibrating
Priors to Market Implied Data. However, we find that usually we want to
calibrate covariances rather than correlations, since it is the
former that drive portfolio risk directly not the latter. It is thus worth
bearing in mind that using as an input to these calibrations an average stock correlation
may not be ideal for calibration purposes, except for instruments more directly
linked to correlation than to covariance.
References
Tierens,
I. and Anadu, M. (2004). Goldman Sachs Quantitative Insights Research Note,
13 April 2004. Goldman Sachs