Extreme Events – Specimen Question
A.2.1(b) – Answer/Hints
[this page | pdf | references | back links]
Return
to Question
Q. Do the statistics
calculated in (a) appear to characterise a fat-tailed distribution if we adopt
the null hypothesis that the log returns would otherwise be coming from a normal
distribution and we use the limiting form of the distributions for these test
statistics (i.e. the form ruling when  , where
  is the number of observations)?
A (univariate) normal distribution is characterised by its
mean and standard deviation, so the values of these two statistics cannot be
used to differentiate between the normal distribution family and other
distributional forms.
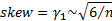
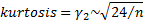
However, we can test for normality by reference to the
observed skew and kurtosis of the sample. If  is
large and if the sample is drawn from a Normal distribution then the skew and
(excess) kurtosis are approximately normally distributed with the following
distributions, see also: MnConfidenceLevelSkewApproxIfNormal
and MnConfidenceLevelKurtApproxIfNormal
is
large and if the sample is drawn from a Normal distribution then the skew and
(excess) kurtosis are approximately normally distributed with the following
distributions, see also: MnConfidenceLevelSkewApproxIfNormal
and MnConfidenceLevelKurtApproxIfNormal
Suppose we wish to reject the null hypothesis that the
sample is coming from a normal distribution with a symmetric two-sided
significance level of  (and we
assume that
(and we
assume that  is
sufficiently large for the above approximations to apply), then we would reject
the null hypothesis if the observed
is
sufficiently large for the above approximations to apply), then we would reject
the null hypothesis if the observed  and
and  are above
 or below
  where
where  is the
(standardised) inverse normal distribution. can be
obtained via the built-in Microsoft Excel worksheet function NORMSINV or via
the equivalent Nematrian web function MnInverseNormal.
is the
(standardised) inverse normal distribution. can be
obtained via the built-in Microsoft Excel worksheet function NORMSINV or via
the equivalent Nematrian web function MnInverseNormal.
For example, if  then
then  . Thus at
this level of significance, index A does not appear to be skewed, but does
appear to be fat-tailed, since the observed value of is 4.62
is significantly larger than 1.96.
. Thus at
this level of significance, index A does not appear to be skewed, but does
appear to be fat-tailed, since the observed value of is 4.62
is significantly larger than 1.96.
Other tests for normality that might be used (including ones
that can handle small samples and/or focus on just some parts of the overall
distributional form) are described in TestsForNormality.
NAVIGATION LINKS
Contents | Prev | Next | Question