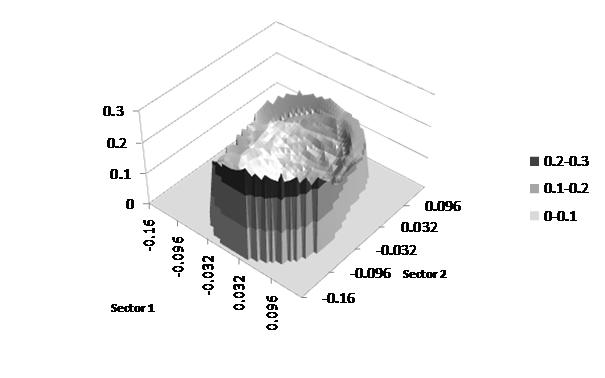
Extreme Events – Figure 3.21: A
two-dimensional ‘upwards’ QQ-plot characterising all (linear) combinations of
two return series
[this page | pdf | references | back links]
SmartChart version:
Not available
Variant used in book:
Source: Nematrian, Thomson Datastream. Copyright (c)
Nematrian (2010)
NAVIGATION LINKS
Contents | Prev | Next | Chapter 3