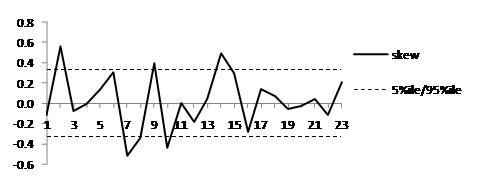
Extreme Events – Figure 3.17: Skewness of
each principal component derived from the relative return series used in Figure
3.13 (most important principal components to the left of the chart)
[this page | pdf | references | back links]
SmartChart version:
Not available
Variant used in book:
Source: Nematrian, Thomson Datastream. Copyright (c)
Nematrian (2010)
NAVIGATION LINKS
Contents | Prev | Next | Chapter 3