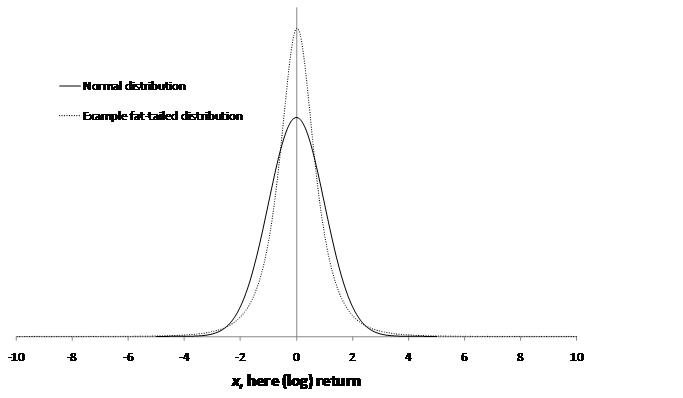
Extreme Events – Figure 2.2: Illustrative
probability density function plot
[this page | pdf | references | back links]
SmartChart version:
Source: Nematrian. Copyright (c) Nematrian (2010)
Variant used in book:
Source: Nematrian. Copyright (c) Nematrian (2010)
NAVIGATION LINKS
Contents | Prev | Next | Chapter 2